CKW Power Plant Production Charts
When the leading electricity supplier in Central Switzerland needed real time visualization of their energy production, they came to us.
The goal of the proof of concept project was to evaluate elasticsearch as a backend to provide data to visualize using varying criteria.
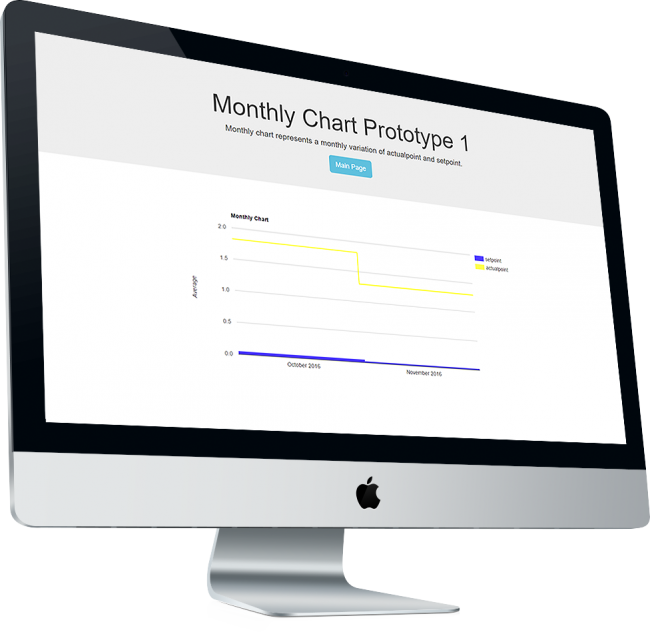
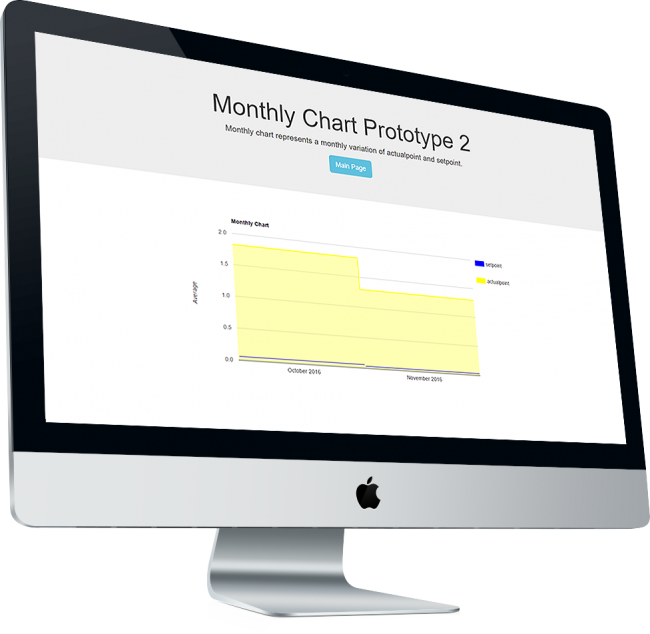
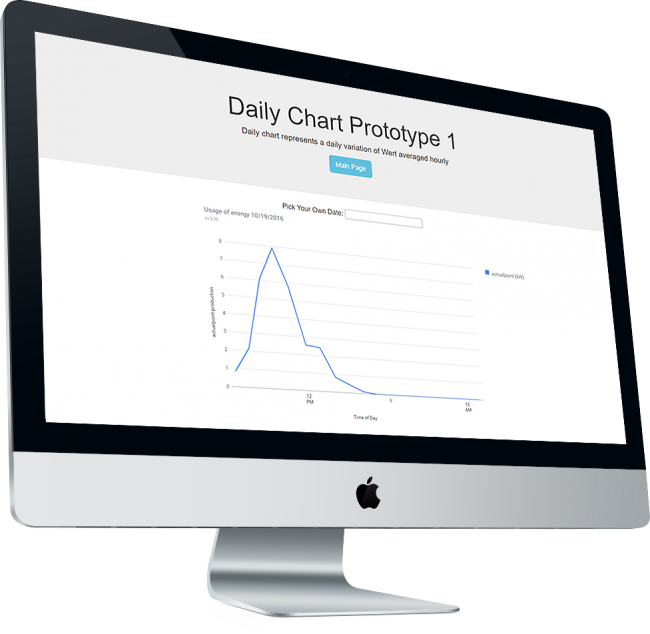
We fed real time data into elasticsearch and integrated Google Charts to prototype the visualizations. We were able to generate all the visualizations we needed to prove that elasticsearch is the right tool for the job.
Technology
Elasticsearch, Logstash, Google Charts, Angular